Auditor Sampling Methodology for SOC 2 Type II Controls
How auditors mathematically prove controls worked reliably across months, not just snapshots.
- Written by
- Compliance Primer Editors
- Updated
- October 20, 2026
- Reading time
- 13 min read
- Sources cited
- 6 sources ↓
What this covers
SOC 2 Type II sampling is not a compliance formality tacked onto the audit for show. It is a math problem with legal weight: how many instances of a control does an auditor have to inspect before they can reasonably say the control worked, reliably, across a stretch of months rather than a single Tuesday afternoon. Type I audits test whether a control is designed correctly at one point in time, like a photograph. Type II audits test whether that control actually ran, correctly, every time it was supposed to, across a window of 3 to 12 months, which is closer to reviewing security camera footage than checking a single frame. Because nobody has the budget or patience to review every log entry, ticket, and approval generated over a year, auditors sample. This piece walks through the standards, the math, and the practical mechanics behind that sampling, section by section, so the logic stops feeling like a black box.
That distinction between a snapshot and a full recording matters more than it sounds. A Type I report can pass on documentation alone: a screenshot of an access control policy, a signed procedure, a config screen showing MFA turned on. Type II throws that photograph away and asks a much less comfortable question: did this control fire correctly in January, again in June, again in November? The auditor isn't asking whether a door lock exists. They're asking whether it locked itself every single night for a year, and whether anyone can prove it. That's where sampling stops being a nice-to-have and becomes the entire mechanism by which the audit functions.
The professional standards that govern how SOC 2 sampling works
The AICPA sets the rules here, through the Trust Services Criteria and its audit sampling guidance, and Type II examinations specifically run under AT-C Section 205. Paragraph.32 of that standard says the auditor's sample has to be one that can reasonably be expected to represent the population across the full reporting period, not just a convenient slice of it.
AT-C 205 tells auditors to weigh four things when deciding how much testing a control needs: the nature of the population and the controls in it, whether the population is made up of similar (homogeneous) items or a mixed bag, how often the control runs, and how many failures the auditor expects to find. Nowhere in there is a number. No governing body, AICPA included, hands auditors a table that says "test 30 items and you're done." Sample size is a judgment call, made inside those four guardrails.
That absence of a fixed number tends to bother people who want a checklist. But AICPA's own definition of audit sampling, under AU-C Section 530, spells out why a fixed number would be the wrong tool: sampling means applying procedures to less than 100% of a population, chosen so every item has a chance of selection, in order to draw a reasonable conclusion about the whole thing. A control tested weekly behaves nothing like one tested annually, and treating them identically would either waste enormous auditor hours on the trivial control or wave through the risky one. The lack of a universal number isn't a loophole. It's the design.
How auditors define the population before a single sample is pulled
Before an auditor can pull a sample, they need to know what they're sampling from, and that step gets skipped in casual conversation more than any other part of the process. Every Type II auditor runs through the same three moves for each in-scope control: define the population, size the sample, then select and verify the specific instances.
Defining the population means identifying the exact system or process in play and the exact stretch of time that matters, then figuring out what artifacts should exist across that entire stretch. For an access control, that's the full list of provisioning events, role changes, and terminations that happened during the observation window, not a curated highlight reel. For a logging and monitoring control tied to CC4.1 or CC7.2, say a weekly review over a six-month window, the population is roughly 26 instances (six months times roughly 4.3 weeks). That number, 26, is what the sample gets sized against, not the number of employees or the number of servers.
Here's the part that surprises people who assume the population step is just paperwork: a gap in the population is itself a finding. If week 14 of that logging review has no dated artifact anywhere, that's not neutral. It's evidence the control might not have run that week, and it shows up in the report separately from whatever conclusion the auditor reaches about the weeks that did produce artifacts. Auditors also check whether the population is homogeneous, meaning all the items are basically the same kind of thing. If it's not, say the population mixes routine access changes with emergency access grants, auditors often split it into strata and treat each group as its own population before sampling either one.
The four sampling methods auditors choose among, and why the choice varies by control
Once the population exists, the auditor picks how to pull items from it, and there are four methods that show up across SOC 1 and SOC 2 work. Simple random sampling gives every item an equal shot at selection, usually done by assigning numbers to each item and running a random number generator, whether that's a dedicated tool or an Excel formula. Systematic sampling divides the population size by the target sample size to get an interval, then grabs every nth item: 250 items divided by a target of 25 means every 10th item gets pulled. Haphazard sampling skips the formal randomization tool but still avoids cherry-picking, and it shows up most often on smaller populations or controls that don't run very often. Block sampling grabs a contiguous chunk, like every transaction from one specific week, and on small enough populations this can mean testing 100% of what exists.
There's also a split between statistical and non-statistical sampling. Statistical sampling uses probability to select items and lets the auditor measure sampling risk with actual math. Non-statistical sampling leans on professional judgment and doesn't produce results you can project mathematically onto the whole population. Both are fine under AICPA and PCAOB standards, as long as they're applied properly, and it's worth noting neither one is automatically "better," they answer slightly different questions.
For tests of controls specifically, attribute sampling dominates. It measures how often a control deviates from what it's supposed to do, and the goal is answering one question: does this control work reliably enough that the auditor can rely on it going forward? Judgmental sampling shows up too, where the auditor deliberately picks items most likely to reveal something useful, and in practice engagements may draw on multiple methods depending on population size, how the population was generated, and how uniform the items are. None of this is arbitrary. A 12-item population of annual controls doesn't need a random number generator. A 5,000-item population of daily automated log entries probably does.
The variables that determine how large a sample needs to be
Sample size isn't one variable, it's five moving at once. Tolerable deviation rate sets the ceiling on how many failures the auditor will accept and still call the control effective. Expected deviation rate is the auditor's prediction, based on prior audits or known history, of how many failures they'll actually find. Assessed risk raises or lowers the bar: a control with a rocky track record, or one sitting inside a high-risk industry, needs more evidence before anyone signs off on it. Confidence level matters too, and SOC engagements typically target a high confidence level, consistent with the high level of assurance the report is supposed to provide. And assurance already gathered through walkthroughs or inquiry can shave down how much sampling is strictly needed on top of that.
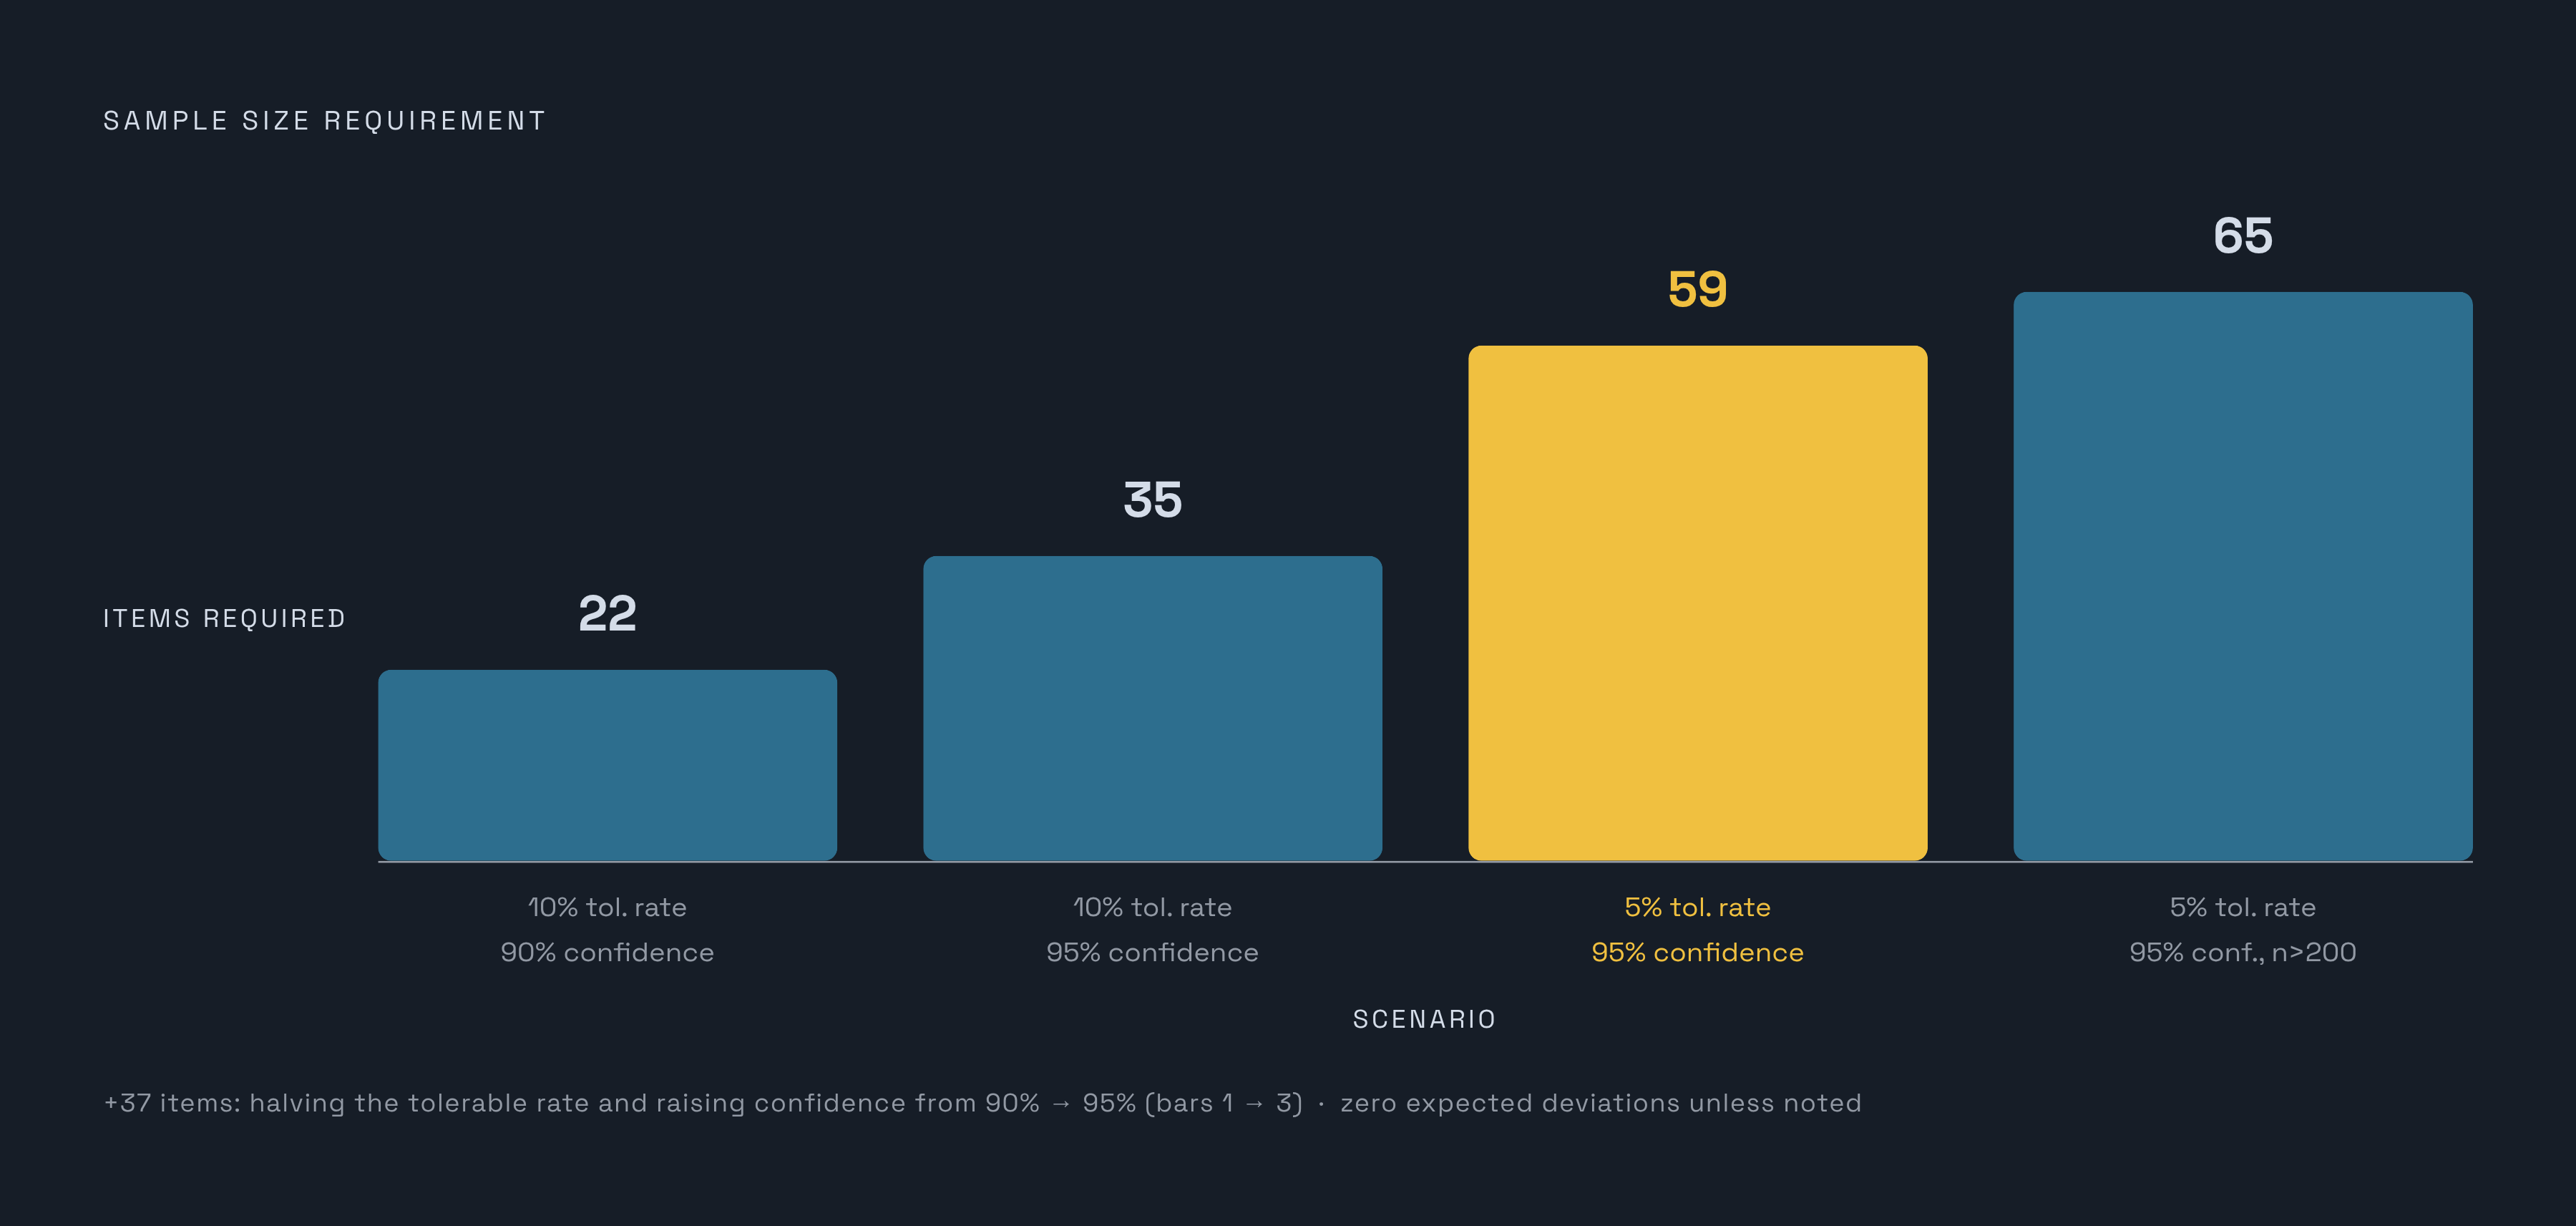
The relationship between tolerable deviation rate and sample size runs backward from what intuition suggests: the less failure you're willing to accept, the more evidence you need to prove that low failure rate is real. Research published in the American Accounting Association's Current Issues in Auditing lays out the range at 90% to 95% confidence: a sample of 22 items covers zero expected deviations at a 10% tolerable rate and 90% confidence, while a sample of 59 covers zero expected deviations at a 5% tolerable rate and 95% confidence. That's nearly a threefold jump in required evidence just from tightening the tolerable rate and the confidence target.
For populations of 250 items or more, tables aligned with AICPA guidance, the kind referenced in Linford & Company's published sampling framework, typically land on 25 to 40 items at a minimum 90% confidence level, with room for up to two deviations before the conclusion changes. Separate analysis from legalclarity.org on AICPA sampling guidance puts a 5% tolerable rate at 95% confidence at roughly 65 items for a population over 200, while loosening the tolerable rate to 10% at that same confidence level drops the requirement to around 35 items.
And here's the myth worth killing outright: there is no rule, written or unwritten, that says sample size should equal 10% of the population. That heuristic gets repeated constantly and it's wrong on its face, because a population of 10,000 daily log entries doesn't need 1,000 samples, and a population of 12 annual reviews can't produce a meaningful 10% sample at all. Size comes from the audit objective, the assessed risk, and the deviation tolerances, not a fixed percentage pulled out of thin air. Most engagement teams plan their initial sample size assuming zero deviations will turn up. What happens when that assumption breaks is its own section, coming up next.
How control frequency directly sets the floor for sample size
Frequency drives everything upstream of it, because frequency is what determines population size in the first place. A daily control running for 12 months generates a population in the hundreds. A quarterly control over that same window generates four. Those two populations cannot be sampled with the same logic, and nobody pretends otherwise.
Annual controls get the cleanest treatment: since the control only runs once a year, testing it once means testing 100% of the population. A sample of one, in this case, isn't a shortcut, it's the whole thing, and it's genuinely rare for any other control frequency to get full 100% coverage.
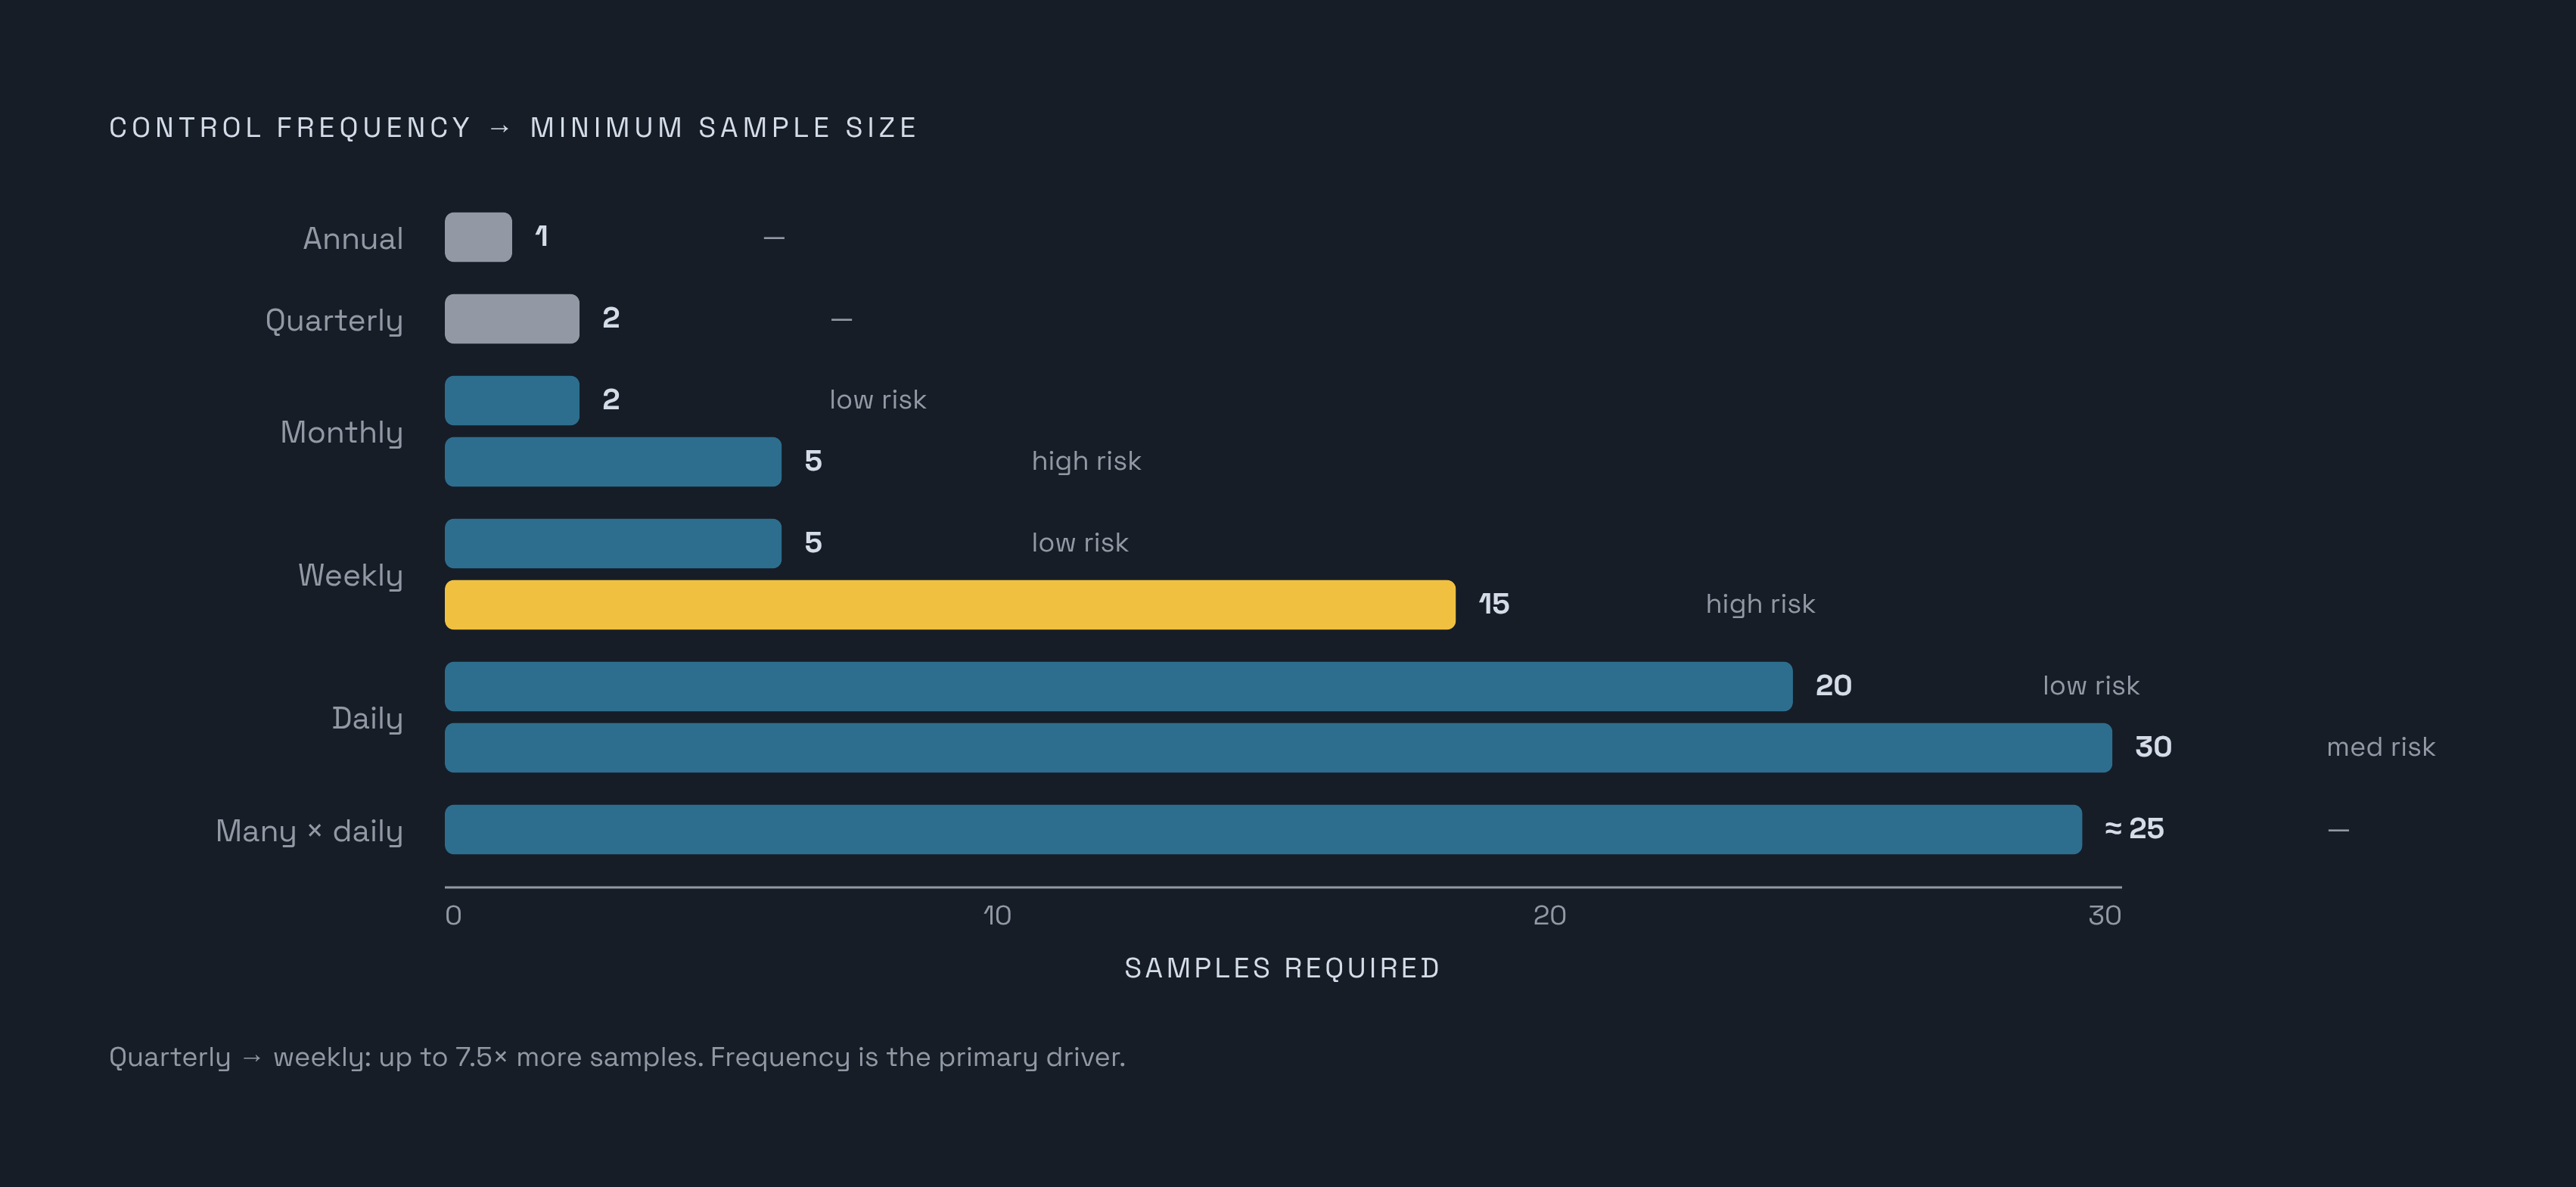
Practitioner norms that circulate in Sarbanes-Oxley compliance circles (from Sarbanes-Oxley Forum discussions, not AICPA-mandated but widely referenced) give a rough sense of what auditors reach for by frequency. Annual controls get tested once. Quarterly controls get tested twice. Monthly controls get two samples if the risk is low, five if it's high. Weekly controls scale from five samples at low risk up to fifteen at high risk. Daily controls run twenty samples at low risk and thirty at medium risk, and controls that fire many times a day (think automated system checks) often land around twenty-five samples per that same forum discussion.
A monthly reconciliation, reviewed by a manager each month, illustrates the small-population problem well. Using AICPA small-population guidance (Table 2), an auditor might select three months out of twelve using haphazard sampling. But because that population only has twelve items total, one missed reconciliation isn't a rounding error, it's a direct failure of operating effectiveness, full stop. Quarterly access reviews work the same way: near the end of the observation period, the auditor asks for records from all four cycles, and if cycle three never happened or never got documented, that's an exception in the final report, not a footnote.
This is also why the length of the observation period matters as much as the frequency itself. A three-month window can't fully capture a quarterly control, since there's barely enough time for that control to run once. A twelve-month window is really the only way to naturally pick up evidence for annual controls like risk assessments or security awareness training. Organizations choosing a shorter first-year window, often three to six months, get through the audit faster, but they need to know upfront which controls simply cannot demonstrate a full track record in that time without arranging out-of-cycle testing.
What happens when the auditor finds a deviation mid-sample
Sample sizes aren't fixed once chosen. They expand the moment a deviation shows up, and the expansion follows a defined escalation, not auditor mood. Published audit sampling frameworks illustrate this escalation using a security awareness training population as an example. The initial sample, assuming zero expected deviations, typically falls in the range of 25 to 40 items, picked through simple random or haphazard sampling. Find one employee who never completed training, and the sample expands to account for the revised expected deviation rate. Find a second deviation, and it grows further still. At some point additional deviations lead the auditor to conclude the control simply isn't operating effectively and further sampling of this control is no longer productive.
That escalation isn't the auditor being punitive about a training compliance miss. It's statistically necessary: each new deviation nudges the auditor's estimate of the real population-wide failure rate upward, and a higher estimated failure rate means more evidence is required before anyone can still defend the tolerable rate set at the start. Once a control is concluded to be ineffective, the auditor doesn't just jot down a note and move to the next control. They typically have to scale up other, substantive testing elsewhere to compensate for the fact that this one control can no longer be relied on.
The most common way a logging or monitoring control draws an exception isn't bad design at all, it's a missing instance: a week where the review either didn't happen or happened without leaving behind a dated artifact. That gap-in-the-population problem shows up constantly, and it means continuous, retrievable documentation carries just as much weight as actually performing the control correctly. Manual controls that are easy to skip tend to sample badly for exactly this reason. Automated controls that generate their own timestamped records, on the other hand, tend to produce clean populations with far fewer surprises mid-sample, because the system doesn't forget to log itself the way a tired analyst might forget to file a ticket on a Friday afternoon.
The four evidence-gathering techniques auditors layer onto their samples
Picking a sample answers "which items," but auditors still need a method for actually verifying each one, and there are four techniques in play. Inquiry means asking the control owner to describe how the control works, and it's generally considered limited evidence for testing operating effectiveness. It gets used mostly to check whether the person running a control understands what they're supposed to be doing, not as proof the control actually ran.
Observation means watching a process happen in real time, which works well during a walkthrough but obviously can't be applied retroactively to something that happened three months ago. Inspection, reviewing documents like logs, screenshots, tickets, and approvals, is the workhorse for testing sampled historical instances, because it leaves behind a verifiable, dated artifact the auditor can point to later. Re-performance, where the auditor independently redoes the control themselves to check the outcome, is the strongest evidence available, reserved for controls where the result can actually be reproduced.
Most controls get tested with a blend: a walkthrough combining inquiry and observation to understand how the control is supposed to work, followed by inspection or re-performance on each item pulled in the sample. What counts as acceptable inspection evidence varies by control type. Access control needs provisioning tickets, role-change logs, and termination records, each with a timestamp. Security awareness training needs completion records tied to individual employees and dated by the training system itself. Log review and monitoring controls need dated review artifacts demonstrating the control ran for each instance. Quarterly access reviews need the completed review document from each of the four cycles, each one dated and showing who approved it.
One rule holds across every control type without exception: inquiry alone is never enough to test operating effectiveness. Every SOC examination has to pair a sampling method with documented inspection or re-performance evidence. Nobody gets to just ask someone if they did their job and write that down as proof.
How organizations can use the sampling logic to prepare evidence at the right volume
The sampling logic in the sections above isn't a mystery an organization has to wait for the auditor to reveal mid-fieldwork. It's knowable in advance. Organizations that understand the frequency heuristics, the deviation expansion thresholds, and how observation-period length interacts with control frequency can predict, with reasonable accuracy, roughly what an auditor is going to ask for before fieldwork even starts.
The practical move is a control-by-control inventory: take every in-scope control, tag it with its frequency, then apply the practitioner heuristics from earlier to estimate the minimum volume of evidence needed. Annual controls need exactly one complete, dated artifact, since that single item is both the population and the sample. Quarterly controls need sampled cycles present and retrievable, and any missing cycle documentation is treated as an exception. Monthly controls should expect somewhere between two and five samples depending on risk rating, and because the total population is so small, a gap in any single month is immediately visible rather than buried in noise. Weekly controls run five to fifteen samples depending on risk, and a missing week isn't just a missing sample, it's a hole in the population itself that raises its own red flag. Daily or higher-frequency controls land in the twenty-to-thirty sample range, and the most defensible setup by far is automated logging that generates its own timestamped artifacts without relying on a human to remember to document anything.
None of this changes what the auditor tests. It changes whether an organization walks into fieldwork with gaps already baked into its evidence, or with a population that's complete, dated, and ready to be sampled the moment the auditor asks for it.
Methodology & sources
- How SOC 2 auditors test
Informed the section describing the four evidence-gathering techniques auditors use: inquiry, observation, inspection, and re-performance.
- https://www.sarbanes-oxley-forum.com/topic/6949/control-frequency-sample-size-1640
Supplied the practitioner norms for minimum sample sizes by control frequency (annual, quarterly, monthly, weekly, daily) cited as widely referenced Sarbanes-Oxley Forum guidance.
- Audit Sampling: Audit Guide (2025)
Provided the AICPA's AU-C Section 530 definition of audit sampling and the rationale for why no fixed sample size exists across all control types.
- https://kfinancial.com/sampling-guidance-for-soc-reports/
Informed the explanation of the three-step auditor process for each control: define the population, size the sample, then select and verify instances.
- https://pcaobus.org/oversight/standards/auditing-standards/details/AS2315
Cited as confirming that both statistical and non-statistical sampling methods are acceptable under PCAOB standards.
- Audit Sampling Methods & Best Practices for SOC Audits
Provided the practitioner sampling framework and table-based guidance for populations of 250 or more items, referenced as Linford & Company's published sampling framework.